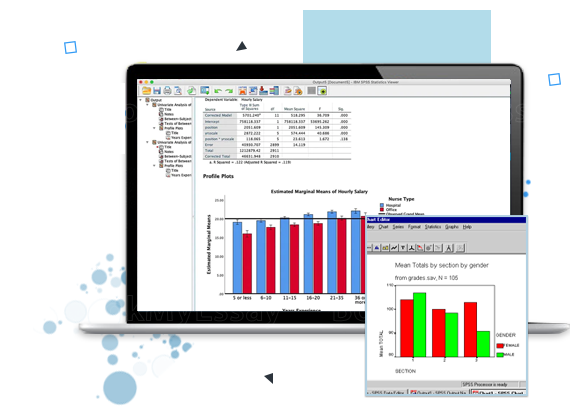
SPSS is the abbreviation for Statistical Package for Social Sciences. It is used by different kinds of researchers for complicated statistical data analysis. SPSS software package was made for statistical and management development. It is considered a world standard meant for social science analysis of data. It is widely coveted because of its straightforwardness, thorough user manual, and English command language.
This software is used by health researchers, market researchers, government entities, survey companies, data mining companies, marketing organizations, education researchers and a lot more to process and analyze survey data.
The Main Functions of SPSS
The main functions of SPSS are discussed in our SPSS Assignment Help
- Statistics Program: Statistics Program offers a wide range of basic statistic functions and some of them are cross-tabulation, frequencies, and bivariate statistics.
- Text Analytics: It helps survey administrators find out powerful insights from survey questions to responses.
- Modeler Program: It allows researchers to create and validate models with advanced statistical methods.
- Visualization Designer: It enables researchers to utilize their data for creating a wide range of visuals such as radial boxplots and density charts from survey data with a lot of ease.
Besides these four functions, SPSS offers solutions for data management that enable researchers to do case selection, file reshaping and build derived data. It provides data documentation that allows researchers to store a metadata dictionary. This dictionary functions like a centralized information repository related to data including meanings and relationships to other usages, origin, data, and format. Other statistical methods can be leveraged in it such as the following:
- Descriptive statistics such as methodologies like cross-tabulation, frequencies, and descriptive ratio statistics
- Linear regression
- Factor analysis and cluster analysis
- Bivariate statistics
Benefits of SPSS
SPSS software is a popular statistical package that can perform highly complicated data analysis and manipulation with simple instructions. It can take data from all kinds of files and use it for generation tabulated charts, reports, and plots of trends, complicated statistical analyses, and descriptive statistics.
It is useful for both quantitative and qualitative analysis. SPSS provides equal importance to both data sets. Though there is other software available in the market for analyzing quantitative data, this software is preferable compared to other software. It is easy to use and user-friendly for beginners and can help to analyze when data becomes bigger.
It is a drag-and-drop method that has the basic and advanced statistical analysis that helps researchers to adopt this software. The benefits are explained in our SPSS Assignment Help.
 Australia
  UK
UK World
World





 3 Bellbridge Dr, Hoppers Crossing, Melbourne VIC 3029