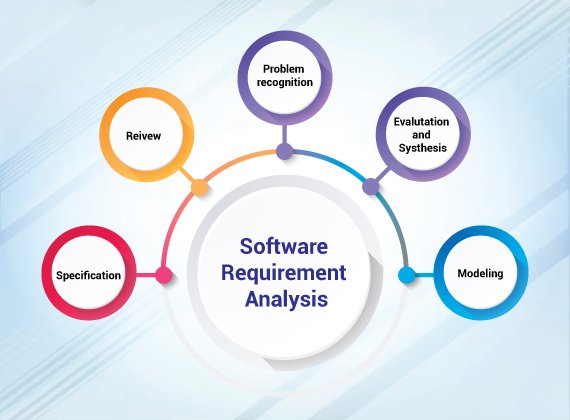
A big challenge faced by organizations is sharing the vision of the end product with customers. A requirement analysis includes team efforts of the major stakeholders, end-users, software developers, and customer managers for achieving an understanding of what a product must do. It is done at the beginning of a project to make sure the end product meets all the requirements. We, at BookMyEssay commit to offer the best Requirement analysis assignment writing solution as per your needs.
The Different Techniques of Requirement Analysis
The different techniques for Requirement Analysis are discussed in our Requirement Analysis assignment help as follows:
BPMN or Business Process Modelling Notation: It is like creating process flowcharts through BPMN that has their own elements and symbols. It is used for creating graphs for business processes. The graphs can simplify a business process. It is hugely popular similar to a process improvement technology.
Flowchart Technique: It depicts the flow and logic of activities, which are related. A flowchart can be in various formats like cross-functional, linear, and top-down. It represents data flows, system interactions, etc. It can be understood easily. Flowcharts are used by technical as well as non-technical users.
UML or Unified Modeling Language: It comprises a set of diagrams, which are created for specifying, constructing, visualizing, and documenting a software system. It is a technique to create object-oriented software. It can validate an architectural design.
Data Flow Diagram: It can represent systems visually that are difficult and complex to say in the text. Data Flow diagram represents information through a system or process. This includes data outputs, data inputs, data stores, and different subprocesses. If you visualize the elements, you can locate the shortcomings. These deficiencies are removed for creating a robust solution.
Gantt charts: These charts are used in project planning because they represent the tasks visually which are scheduled with the timelines. The Gantt charts can help to know the projects that should be completed within the scheduled time.
Role Activity Diagrams or RAD: RAD represents the role-activity diagrams. These diagrams capture the role and dynamics of an organization. Activities may be performed in isolation or might need coordination along with other activities.


 3 Bellbridge Dr, Hoppers Crossing, Melbourne VIC 3029
