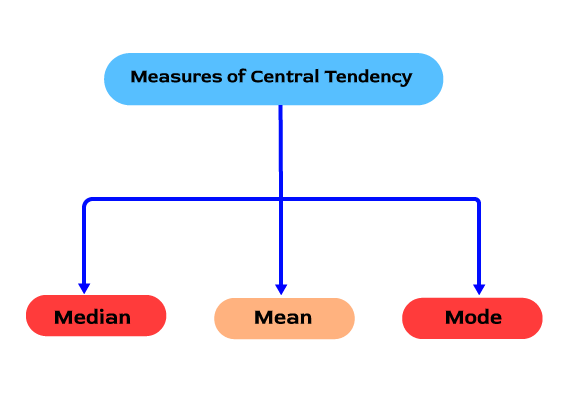
A central tendency is different from variability and dispersion that arises due to the characteristics of distributions. The mean measures the central tendency, which you are familiar with most, however, there are median and mode. The valid measures of central tendency are the mean, median, and mode. However, under various conditions, some central tendency measures are more appropriate to use compared to others.
The Three Measures of Central Tendency
The three measures of Central Tendency are discussed in our Measurement and Central Tendency assignment help in Australia as follows:
Mean: The mean is an arithmetic average that measures the central tendency. It is simple to calculate the mean. Generally, this is known as the arithmetic mean. The other measures of the mean are harmonic mean, geometric mean, and weighted mean. If the values in a dataset remain the same, then all harmonic, arithmetic and geometric mean values remain the same. When there is variability in data, the mean value varies. It is easy to calculate the mean value. The formula for calculating the mean value is as follows:
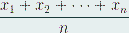
In symmetric distribution, a mean value is situated at the centre accurately. However, in skewed data distribution, an extreme value pulls a mean value from the centre.
Median: Median is a middle value. This is the value that divides the data in half. For finding out the median, order the data from the smallest to the largest. Thereafter, find a data point, which has equal values below it and above it. The method to locate the median differs depending on whether the dataset has an odd or even number of values.
Mode: A mode is a value that happens most frequently in a dataset. In a bar chart, the mode is the highest bar. When the data contains multiple values, which are tied to happen frequently, you shall have a multimodal distribution. When a value does not repeat, the data does not have a mode.
 Australia
  UK
UK World
World





 3 Bellbridge Dr, Hoppers Crossing, Melbourne VIC 3029